
Make optimum decisions by understanding the status of your asset health
You are required to make asset management decisions to balance cost, risk and performance to deliver on your business expectations, goals and targets. To make decisions with the best possible outcome you need accurate information about your physical assets. You need to understand your asset health to address the gaps to function and to prioritise work and investment.
You can optimise your decisions based on the data you already have in your EAM, CMMS or ERP. Currently, this data is not well utilised to give you the information you need. We will unlock your data and provide you with the information you need to make optimum decisions to meet your business expectations.

Unlock the power of data driven decision making
We will use our expert engineering capability, together with our advanced data analysis platform to provide you the information you need. We use the data in your CMMS, EAM or ERP as well as other sources for this service. We work with any CMMS, EAM an ERP systems, some of which include but not limited to:
- Maximo
- SAP
- Ellipse
- Mainpac
- MEX
- FSI
- Archibus
We will extract value from your data no matter the information system or how poor or limited that data appears to be at first sight. With our approach using a combination of machine learning, expert engineers and heuristic and meta-heuristic analysis, low-quality data is utilised to provide insightful and powerful reports designed to optimise the specific decisions which need to be taken by a range of stakeholders.
So how does it work and what do you get?
Extract data from your information systems
We will work with your teams to extract the required data fields from your information systems. To assist in this process, we will provide you with data extract requirement and templates. The data that we will require is both master data and transactional data.
The minimum data required for the analysis is:
- Location / asset/ equipment registers master data; and
- Work order data.
We also process other data sources for enhanced outcomes. These are but not limited to:
- Work requests or notifications;
- Work orders;
- Operator logs;
- Downtime logs;
- Asset utilisation systems; and
- Condition monitoring data.
Data transfer
We utilise ShareFile by Citrix, a secure encrypted data transfer service for data transfer and secure storage at rest. This enables your team to securely transmit the data to us without limits to file sizes.
Asset reliability data analysis
Key failure classes will be determined and reported on with recommended actions. Failure classes can be for equipment classes and can be drilled down to individual equipment. You will be able to investigate specific issues and will be informed of the true performance of your assets. This will inform the asset management decision making in reliability risk factors as well as the quantum of corrective and reactive work which can be used for cost modelling and provisioning.
We do not rely on any data codification to determine failure classes
Our analysis does NOT rely on any codification to determine failure classes within the data sets provided. Instead, our software will process the free text of the work descriptions using machine learning and unique algorithms which cope with language, spelling issues, acronyms and other variants.
Asset Reliability Data Analytics Case Example
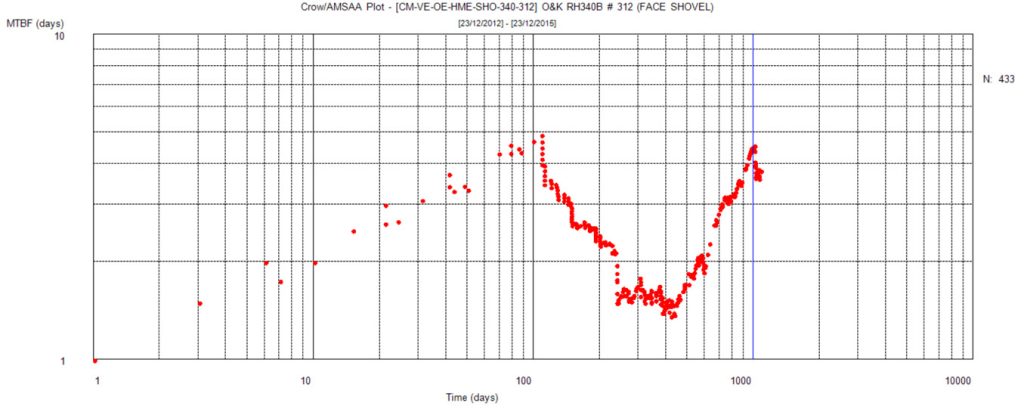
An example of a reliability analysis is provided below for a shovel at a large mine. The principles equally apply to any other item of equipment operated in other industries. The key type of report which is used is the Crow AMSAA applied to work order data. In the plots below, trends in the work orders going down represent the likelihood of reducing reliability.
Example : XXX-HME-SHO-340-312 O&K RH340B # 312 (FACE SHOVEL)
The mean time between corrective maintenance events are plotted for the Face Shovel asset
Then there is exploration of failure classes against the face shovel which is shown in the Pareto plot
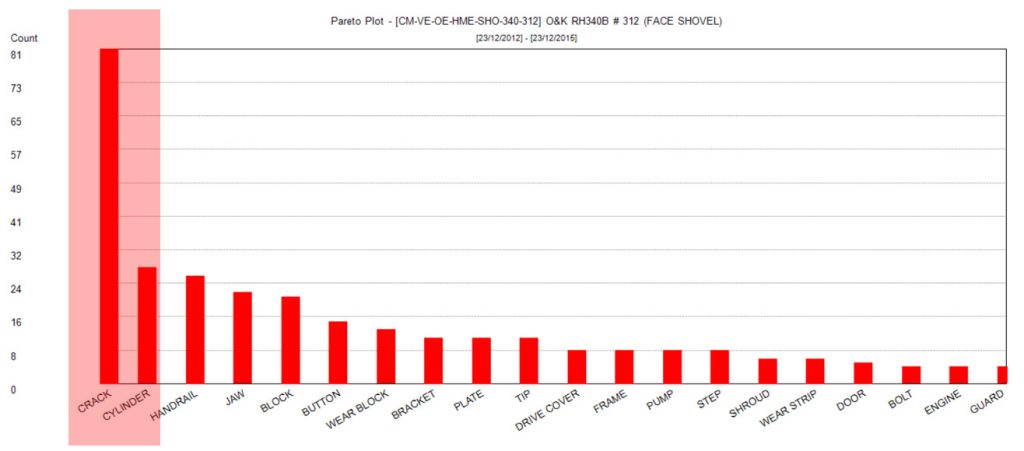
What does this mean? Is this machine starting a downswing of crack repairs? If so, does it need a major overhaul and fix all the cracks in one go?
We explore the Crack mode further:
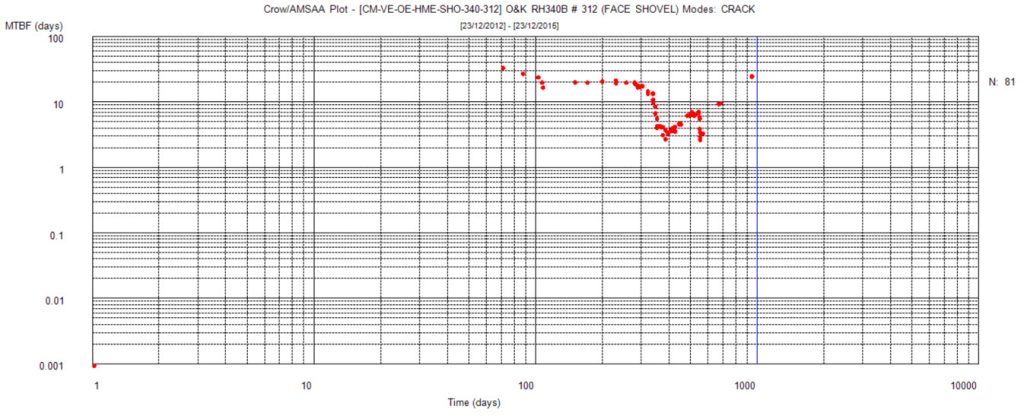
Crack repairs are not increasing so this is not the issue. Further analysis shows that jaw failures are a concern. This can be seen in the plots below.
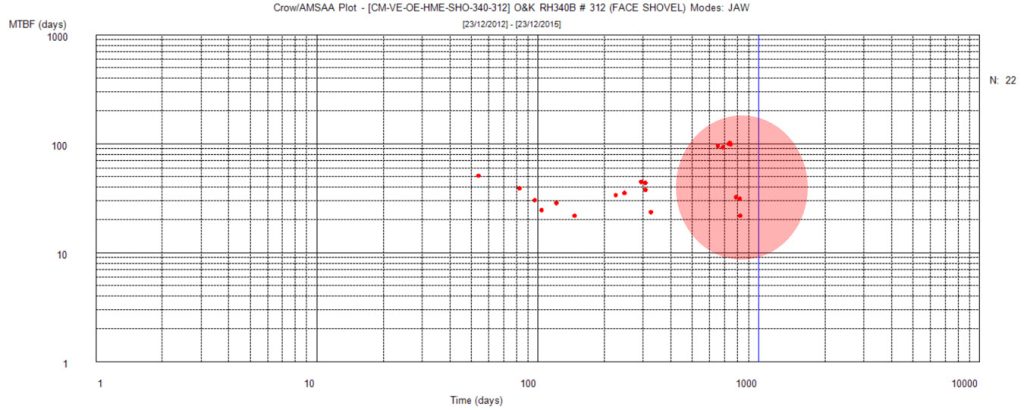
Jaw issues are becoming a problem with a shape factor, b = 0.82 – close to random failure.
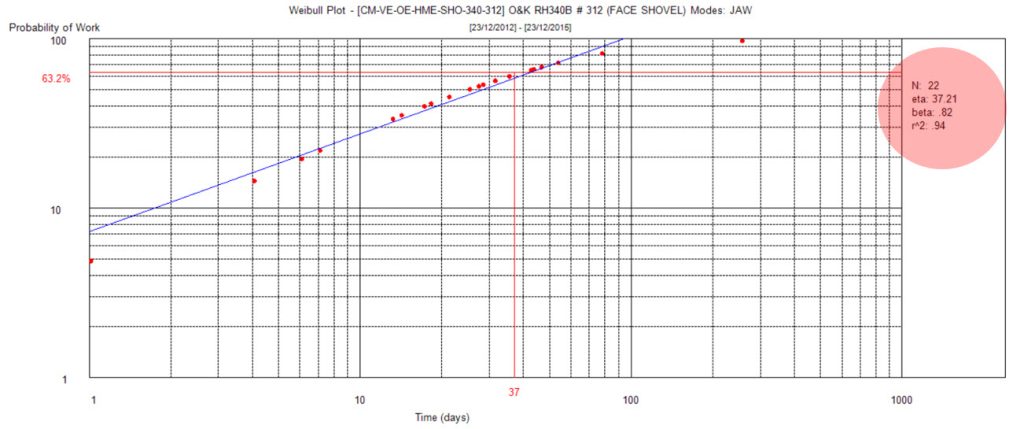
The analysis has shown that this face shovel went through a period of decreasing reliability but the maintenance team have since recovered this problem. Key failure modes were determined, two of which were of interest: cracking and jaw failures. The cracking issue is shown to have been now resolved but random jaw failures are now a concern. The maintenance team can now investigate this specific issue on this machine.
Cost data analytics
We will undertake maintenance cost data analytics that will inform the understanding of the maintenance expenditure bottom up across the client asset base and will identify poor performers. The cost analysis will provide bottom up cost reporting that can be rolled up to asset class/type, building, space or service level. Cost will be reported by but not limited to (bespoke reporting needs can be easily accommodated):
- Service types
- Location
- Asset Type/Class
- Work Type (Corrective, Preventive, breakdown etc)
Covaris will also provide rolled up comparative reporting and internal benchmarking of client asset types, service types, buildings and spaces (rolled up reporting as required) where best practice and poor performers can be identified, reported and visually plotted.
A review of the maintenance performance (in mean time between failures, SMTBF) versus size of the individual facilities (SFAC) is then reported below.
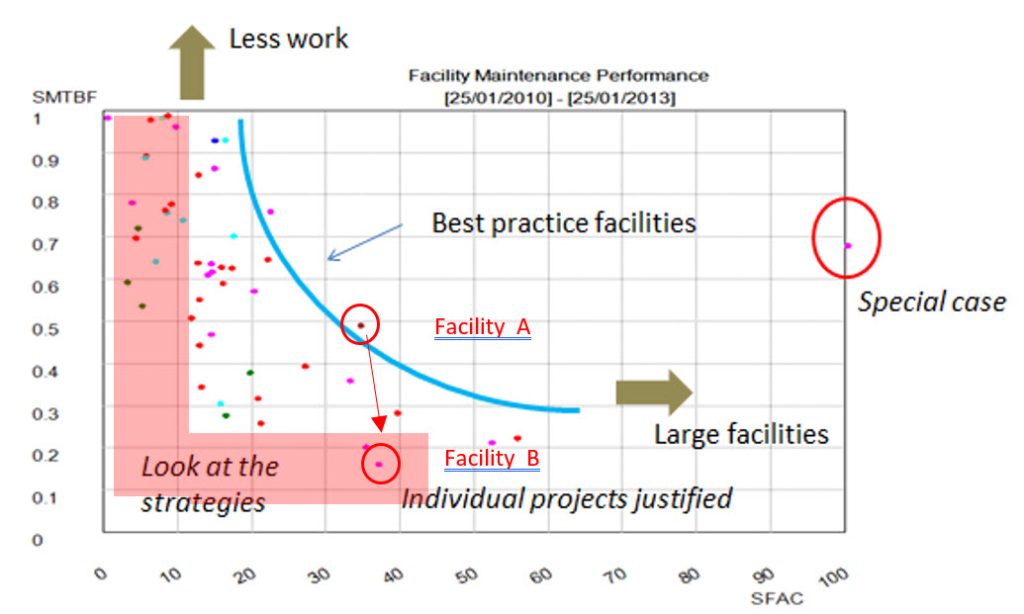
In the example, above, this type of reporting allows to identify those assets, or buildings well away from the best practice internal benchmark (e.g. Facility B) where the rate of work is very high compared to the number of assets which are located at the site. Using this approach, it is possible to distinguish facilities which are too expensive in their maintenance approach for the size of the asset base present at the site.
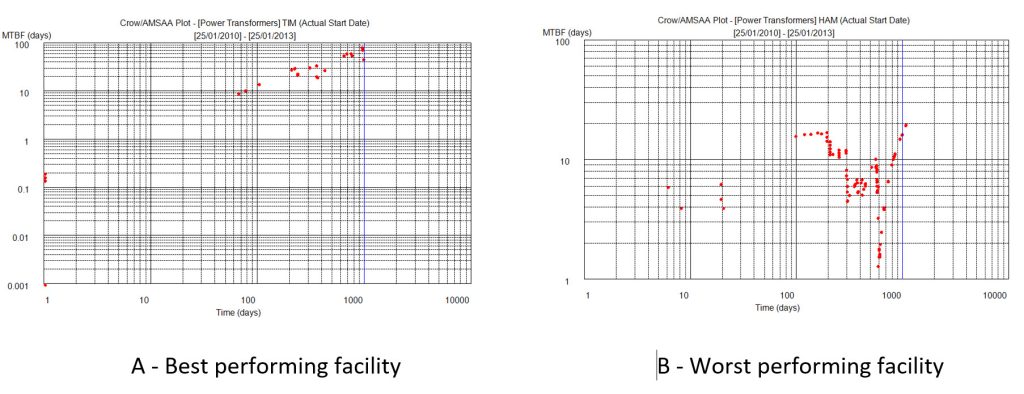
For example, our search techniques in this example found a clear distinction between the reliability performance of power transformers at a facility (Facility A) with benchmark good cost performance as compared to one at a facility (Facility B) with poor cost performance:
Action items and improvement opportunities
Based on your asset data and the asset data analytics undertaken we will identify and develop action items and improvement opportunities collated into a continuous improvement plan for your site or portfolio of sites.
Formal report
We will provide a comprehensive report which will allow you to work with your teams to investigate the developed action items and improvement opportunities based on specific asset performance issues identified. The time frame from receipt of data to the issue of the report is between 2 to 3 weeks. We can provide this type of in depth asset health reporting very quickly due to our proprietary software which we have developed over 20+ years, our experienced engineers and analytical processes.